Indicators on Supplier Closures and Trends in 2020

The past year has been chaotic. Between pandemic-related shutdowns and wildfires in California, the beverage alcohol industry has faced a gamut of challenges across all three tiers. With this article, we wanted to look at the effect on the supplier tier superficially. With many smaller suppliers dependent upon on-premise sales (through tasting rooms, brewpubs, and distilleries), it’s logical to surmise the industry would see increased supplier closures similar to the results in the on-premise.

Using bw166’s Label Inquiry tool, we’ve compiled data on how many suppliers have submitted COLAs to the TTB from 2016 through 2020. This data allows us to identify suppliers that have consistently filed COLAs year over year, when suppliers have first filed COLAs, and identify suppliers that filed previously but not in the current term. While there are limits to this dataset (i.e., not all beer products require a TTB COLA), the consistent measurement over time allows for a reasonable degree of confidence in the results.

Beer –

  • From 2016 through 2019, the Beer industry consistently showed an increasing number of suppliers – from 1,650 in January 2016 to 2,430 in January 2020. However, 2020 is the first year of declines – falling to 2,250 in December 2020. This decline of -9% in breweries is likely understated (as using a rolling 12-month figure (to smooth seasonality) doesn’t reflect nearer-term closures.

  • New beer suppliers spike in early 2018 and have declined since, with a more pronounced decline in 2020. In January 2020, there were 800 new suppliers versus only 630 in December 2020 (this was roughly the level of new entrants in 2016).

  • Overall, the number of lost beer suppliers continues its upwards trajectory. Interestingly, we have not seen a significant increase in closures during 2020 (though this may again be affected by looking at 12 months of data).

Spirits –

  • The Spirits industry has shown a significant increase in supplier count since 2016 – rising from 1,000 in January 2016 to 1,660 in December 2020. Through 2020, the number of suppliers has continued to increase (albeit with a slight decline from 1,700 in November 2020 to close out the year – though this may just be volatility in measurement than reflective of significant changes)

  • The number of new spirits suppliers steadily increased between 2016 and 2020. During 2020, the number of new suppliers peaked at 660 in August and then fell to 630 in December – still near the high point historically and above the 600 new suppliers in January 2020.

  • Lost spirits suppliers have been steadily rising from 2016 through 2019 – starting at 250 in January 2016 and ending at 503 in December 2019. This trend has been reasonably stable throughout 2020 – staying just above or below that 500 supplier count (ranging between 470 and 520 during any particular month).

Wine –

  • Wine suppliers saw a steady increase from 2016 through 2019 (from 4,400 in January 2016 to 4,760 in December 2020), followed by a significant increase in early 2020 and then a decline to end the year in December. The probable explanation for these results, particularly the disconnected data in 2019, is attributable to the government shutdown in January 2019, which altered COLA approval patterns.

  • New wine suppliers showed a steady though slight positive increase from 2016 through 2019 – starting at 1,480 in January 2016 and ending at 1,580 in December 2019. The government shutdown explains the rapid rise in January 2020 (1,770 new suppliers). This shift also explains the apparent drop in new suppliers through 2020, ending at 1,580 in December 2020 – exactly in line with the historically stable numbers.

  • While lost wine supplier counts increased in 2020 (from 1,400 in January to 1,610 in December), these numbers are reasonably in range of historical results. The other unexplained facet is the potential effect of the California wildfires. With lost crops, a natural consequence would be delays or cancellations in new products, which may also explain this rise in lost suppliers.

Closing Thoughts

  • Overall, there does not seem to be a significant acceleration of closures in the supplier tier. Instead, the current data suggest a continuation of existing trends in terms of closures.
  • The more considerable impact in the supplier tier seems to present itself in the deceleration of new suppliers. Given economic and COVID-related uncertainty, it is logical that individuals would be hesitant to start a new venture.
  • If you found this article helpful or informative (or if not), send us a note at admin@bw166.com. If there’s enough interest, we can look at publishing an updated analysis in the future.

For more granular insights and data about Product Approvals, subscribe to the Label Inquiry by bw166 or visit our website at www.bw166.com.

Tequila-Based Seltzers and More: New Product Approvals

Following up on our post yesterday (The Increasing Fragmentation of Seltzers) and the recent Beer Business Daily article (A-B Jumps into the Ranch Water Game), we decided to dive deeper into who’s launching Tequila/Agave-based products using bw166’s latest tool, Label Inquiry.

Looking directly at Tequila Seltzers and Sodas, we have several recent product approvals:

  • Nude Tequila Soda in three flavors: Grapefruit, Pineapple, and Lime

Nude Tequila Soda

  • Proof Point Tequila Seltzer with a Grapefruit Splash
  • Dulce Vida Tequila & Soda Pineapple
  • Capriccio Ranch Water Mang Passion
  • Hornitos Tequila Seltzer in three flavors: Lime, Mango, and Pineapple

Hornitos Tequila Seltzer

  • Lakehouse Cocktails Spicy Tequila Cocktail
  • Jose Cuervo Sparkling Margarita (not labeled a Seltzer but at 150 calories and 12 proof, it generally fits the segment)

Jose Cuervo Sparkling Margarita

Another category extension is margarita ice pops. Two brands have recently received product approvals: Sloshee (a margarita flavor at 20 proof) and Cazul 100’s Spirit Pops (in Lime Margarita, Mango Margarita, and Strawberry Margarita – all 100 calories and 16 proof).

Cazul 100 Strawberrry Margarita Spirit Pop

There is also a proliferation of agave-based wines and cocktails, with brands such as Playa Vallarta, Agavino, and Agavales all receiving recent TTB approvals. Additionally, larger suppliers are playing this space. Bronco Wine Company received approvals for two labels of La Catrina (Classic Margarita and Strawberry Margarita). Don Sebastiani received approvals for wine cocktail kegs for their Flybird brand (in Strawberry Margarita and Baja Lime Margarita)

La Cartina Classic Margarita

Even Michelob Ultra is playing in the agave-flavor space with recent approval for an Infusions Pomegranate & Agave light lager.

Michelob Ultra Infusions Pomegranate & Agave

Lastly, while not in the Tequila-space, Jim Beam is receiving label approvals for products such as Jim Beam Ginger Highball, Jim Beam and Cola, and Jim Beam Classic Highball (all ten proof with calorie counts between 105 and 250 calories).

Jim Beam and Cola

These are just a handful of the recently approved products entering this space. Some of these big-name brands and suppliers may have enough clout with retailers to acquire valuable shelf space. Still, only time will tell if they’ll generate the same consumer pull relative to the existing products like White Claw and Truly.

For more details regarding our Label Inquiry application, please visit our Introducing Label Inquiry page.

The Increasing Fragmentation of Seltzers

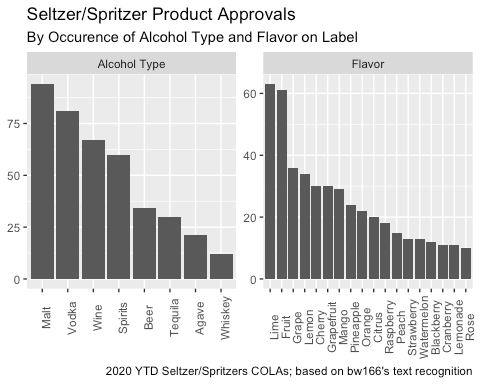
With the rapid growth of the seltzer category, it was inevitable that more participants will chase that growth. Using our newest tool, Label Inquiry, we thought we’d take this opportunity to understand how many and what new entrants are making a play at the seltzer space (for this analysis, we included any labels containing Seltzer or Spritzer on the label).

Through October 2020, the TTB approved 349 labels containing either Seltzer or Spritzer, compared to 198 in the entirety of 2019 (+76.3% and with two months to go).

Interestingly, Spirits-based products have seen the largest increase in product approvals, with 150 labels approved YTD October 2020 (vs. 55 in CY2019). Beer-based products received 128 approvals YTD October 2020 (vs. 102 in CY2020) Wine-based products have seen a slight uptick to 71 product approvals (vs. 41 in CY2020). Note: bw166’s Label Inquiry tool is based only on products requiring TTB COLAs so is not fully comprehensive of malt beverages.

Using the color feature from Label Inquiry, we also took a look at the dominant color used on labels. While neutral colors (Black, White, Beige) are generally dominant, the next three most prevalent palettes are Pink, Red, and Lavender. The commonality in color may represent an opportunity for new entrants to distinguish themselves on the shelf further and stand out in consumers’ eyes.

Lastly, we were curious about the breakdown by source alcohol as well as flavor. Malt and Vodka make up the two largest occurrences (followed by Wine, generically). The more interesting finding is the reasonably large share of labels specifying either Tequila or Agave on the label. When looking at flavors, Lime and Fruit are dominant, followed by Grape and Lemon. Intuitively, fruit flavors represent the predominant options. However, there are some more interesting results. For example, Grapefruit and Mango occurring more frequently than Strawberry and Watermelon. This data may ultimately point to a triangulating consumer demand around core flavors or, perhaps more interestingly, represent an opportunity to differentiate one’s product from competitors.

While we can’t predict the exact results of what these increasing product launches will mean; the scale of the category and the diversity of entrants seems reminiscent of the rise in FMB products in the early 2000s following the success of Smirnoff Ice (Would anyone care to admit trying the likes of Captain Morgan Gold, Skyy Blue, or Sauza Diablo?). Only time will tell if any of these new products can unseat White Claw and Truly.

For more details regarding our Label Inquiry application, please visit our Introducing Label Inquiry page.

TTB Approved 163.5K Products L12M through October 2020, A Decrease of -13.3K (–7.5%)

By Category:

  • Beer: 40K products approved over the L12M (–1.3% vs. last year) and 10K over the L3M (–14.7% vs. last year)
  • Spirits: 17.7K products approved over the L12M (+13.4% vs. last year) and 4.8K over the L3M (+1.3% vs. last year)
  • Wine: 105.9K products approved over the L12M (–12.3% vs. last year) and 23.5K over the L3M (–30.9% vs. last year)

By Origin:

  • Domestic: 90.3K products approved over the L12M (+3.5% vs. last year) and 21.3K over the L3M (–11.5% vs. last year)
  • Imports: 73.2K products approved over the L12M (–18.3% vs. last year) and 16.9K over the L3M (–35.7% vs. last year)

For more information regarding Product Approvals including detailed category breakdowns and origin information (State for Domestic products and Country for Imported products), subscribe to the bw166 Product Approvals Report or visit our website at www.bw166.com.

TTB Approved 165.6K Products L12M through September 2020, A Decrease of -9K (–5.2%)

By Category:

  • Beer: 40.1K products approved over the L12M (–0.3% vs. last year) and 9.9K over the L3M (–13.7% vs. last year)
  • Spirits: 18K products approved over the L12M (+22.1% vs. last year) and 4.5K over the L3M (+11.7% vs. last year)
  • Wine: 107.6K products approved over the L12M (–10.2% vs. last year) and 24.8K over the L3M (–30.4% vs. last year)

By Origin:

  • Domestic: 90.6K products approved over the L12M (+5.4% vs. last year) and 22.2K over the L3M (–9.2% vs. last year)
  • Imports: 75K products approved over the L12M (–15.4% vs. last year) and 17K over the L3M (–36.1% vs. last year)

For more information regarding Product Approvals including detailed category breakdowns and origin information (State for Domestic products and Country for Imported products), subscribe to the bw166 Product Approvals Report or visit our website at www.bw166.com.